Two Week,Two Conferences, and a Deeper Dive into Nairobi’s Urban Heat
The past two weeks have been intense but incredibly rewarding. I’ve been juggling three major commitments, all orbiting around my research.
First, I presented at two conferences: the American Association of Geographers and the Jesus College MCR Conference. In between, I gave a 20-minute Chalk Talk to the MCR community—sharing my project in a more informal, discussion-driven setting. (For context, the MCR—Middle Combination Room, is essentially the postgraduate counterpart to the undergraduate JCR a space where ideally postgradute students interact.)
But beyond the presentations, the real story lies in the work itself.
Mapping Trees in a Growing City
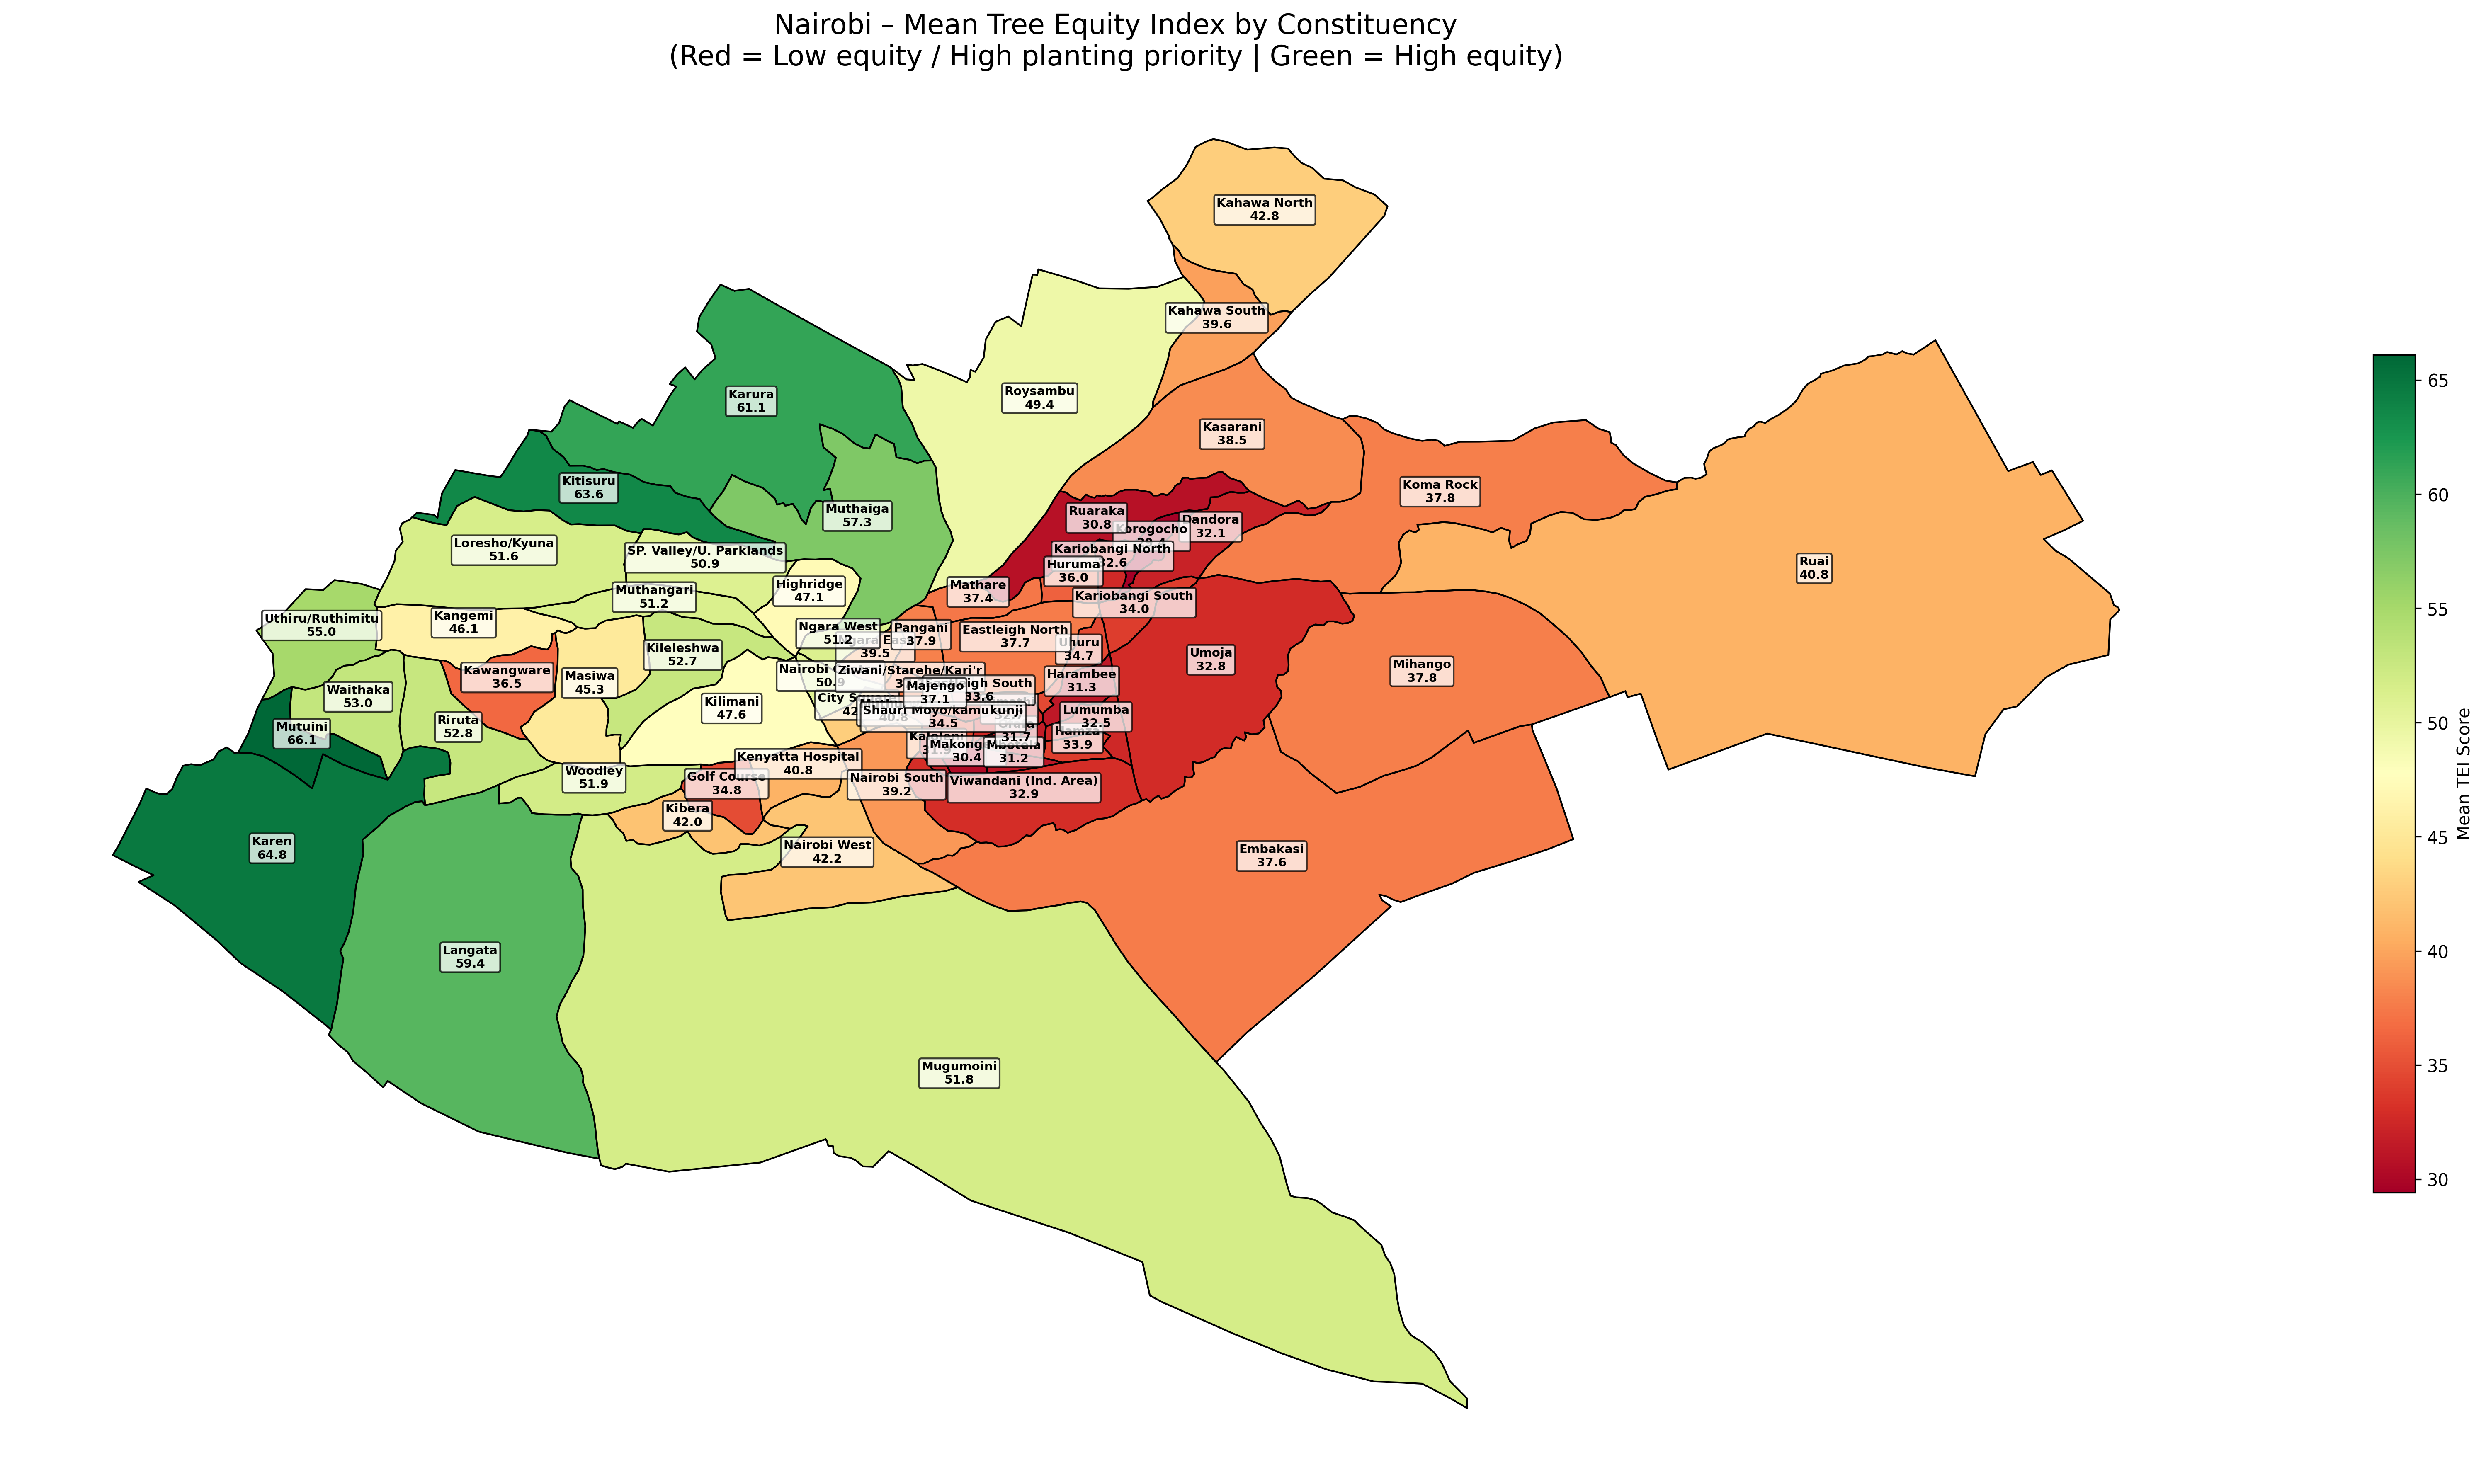
A big part of my recent work has focused on Nairobi specifically, understanding how urban growth is reshaping its environmental landscape.
One of the key tools I developed is a Tree Equity Index (TEI). The idea is simple in principle but quite involved in practice. I started by extracting built-up areas using the Global Human Settlement Layer dataset, then divided the city into 100 m grids. On top of this, I overlaid tree canopy data from the Dynamic World and ESA WorldCover datasets.
The result? A spatial estimate of how tree cover is distributed across Nairobi’s built environment.
Heat, Inequality, and the Urban Fabric
From there, I moved on to analysing the Urban Heat Island (UHI) effect across settlement areas,essentially mapping where heat is most concentrated in the city.
The next step (already underway) is to statistically explore the relationship between UHI, tree equity, and built-up density. Alongside this, I’ve been developing heat risk maps for Nairobi’s wards, as well as corresponding tree equity maps. (Full disclosure: I actually completed this part earlier; I just never got around to publishing this write-up.)
I’m also working on what I’m calling a Greeness Index. This takes a slightly different angle: instead of just measuring where green space exists, it asks how accessible it is. By mapping all public parks and calculating walking times to reach them, I hope to capture how easily residents can access open, green spaces in their daily lives.
Why This Matters
My research centres on building thermal resilience but I’ve come to realise that this can’t be done in isolation. To design meaningful interventions, we need a broader understanding of the urban system.
Urban Heat Island hotspots, for instance, are not just warmer they are more vulnerable. During heatwaves, these areas become points of acute stress, making them priority targets for mitigation strategies. The same applies to tree cover: the Tree Equity Index highlights where greening efforts are most urgently needed.
A City of Uneven Landscapes
What’s become increasingly clear is that heat and greenness are not evenly distributed. The maps are clear heat is not a physical phenomenon but a social one too.
Hotter areas tend to coincide with informal settlements and socioeconomically deprived neighbourhoods. These same areas often have less tree canopy and poorer access to public green spaces. In other words, the people most exposed to extreme heat are also those with the fewest natural buffers against it.
The Scale of Change
Perhaps most striking is the pace of Nairobi’s expansion.
In 1975, the city’s built-up area covered roughly 48 km². By 2025, this has more than doubled to around 103 km much of it is urban sprawl and uncontrolled densification. This rapid growth has come at a cost: the loss of urban greenery and the spread of impervious surfaces, both of which intensify the Urban Heat Island effect.
There’s still more to explore, especially as I move into deeper statistical analysis but one thing is already clear: understanding how cities grow, heat up, and green (or don’t) is essential if we’re serious about building climate-resilient urban futures, more importantly for the rapidly growing African cities.
Back to top